Node.js + Sentry in 2026: Production Error Monitoring & Performance Guide
Production Node.js services fail in ways your tests never see: a malformed payload from a third-party webhook, a Redis connection that hangs at 3 a.m., an unhandled promise rejection that quietly takes down a worker. In 2026, the question is no longer whether you instrument your application — it is how fast you detect, group, and ship a fix before users tweet about it.
Sentry has become the default error-monitoring layer for Node.js teams, packaging exception capture, distributed tracing, performance profiling, and release health into one SDK. This guide walks through a production-grade Sentry setup for Node.js in 2026 — from the @sentry/node initialisation that actually works in serverless and containers, through performance tracing, source maps, alert routing, and the team rituals that turn raw error data into shipped fixes.
Why Production Node.js Needs Dedicated Error Monitoring in 2026
Node.js's event-loop and async nature make it uniquely prone to silent failures. A rejected promise without a `.catch()` does not crash the process under Node 20+ — it logs a warning and keeps running, often in a degraded state for minutes before anyone notices. Console logs alone cannot answer the operational questions that matter: how often is this error firing, which users hit it, what was the request payload, what release introduced the regression, and what was the surrounding code path?
The hidden cost of log-only monitoring
Teams that rely solely on log aggregators (Loki, CloudWatch Logs, Papertrail) typically discover production bugs hours after they start firing. Without grouping by stack trace fingerprint and release, the signal-to-noise ratio collapses: ten thousand log lines from the same broken endpoint look identical to ten thousand unrelated errors, and on-call engineers stop reading the channel.
What Sentry adds on top of structured logging
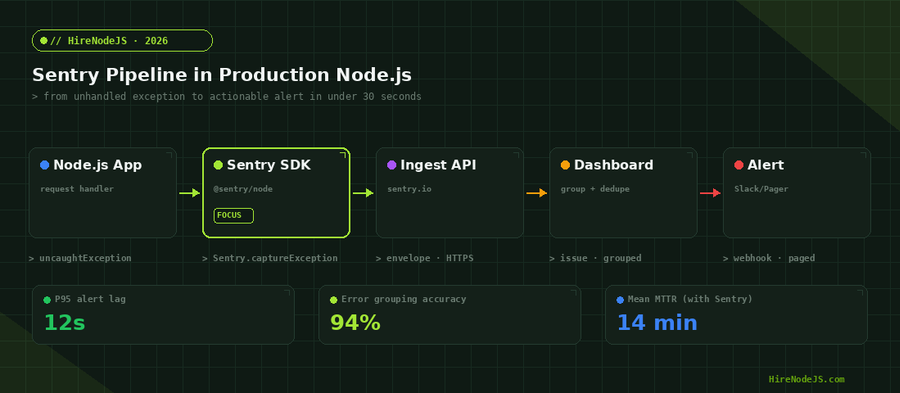
Sentry is purpose-built for exceptions and performance, not free-text logs. It fingerprints errors by stack trace, deduplicates them into issues, attaches breadcrumbs (HTTP calls, DB queries, console output leading up to the crash), captures user, release, and environment context, and surfaces regressions by release. The 2026 release of @sentry/node also bundles a built-in profiler that captures CPU samples at the moment of slowness — no separate APM agent required.
Installing @sentry/node — The Production-Safe Setup
Sentry's Node.js SDK ships as @sentry/node with optional companion packages for profiling, OpenTelemetry, and framework-specific instrumentation. The single most common mistake in 2026 is initialising Sentry too late — after Express or Fastify has already registered middleware, or inside a route handler. The SDK has to load before any other instrumented modules so its auto-instrumentation can monkey-patch HTTP, fs, and database clients.
Step 1 — Install the packages
Install the core SDK plus profiling support. For OpenTelemetry-based tracing (the default in v9+), no additional packages are required — Sentry now includes OTel under the hood and exposes its semantic conventions.
npm install @sentry/node @sentry/profiling-node
# or:
pnpm add @sentry/node @sentry/profiling-node
Step 2 — Create an instrument.js file imported FIRST
Put initialisation in its own file and import it at the very top of your application entry point, before any other require/import. This guarantees Sentry's instrumentation hooks attach before frameworks load.
// instrument.js — load this BEFORE anything else
const Sentry = require('@sentry/node');
const { nodeProfilingIntegration } = require('@sentry/profiling-node');

Sentry.init({
  dsn: process.env.SENTRY_DSN,
  environment: process.env.NODE_ENV || 'production',
  release: process.env.GIT_SHA, // populated by CI

  // Performance Monitoring
  tracesSampleRate: 0.1,        // 10% of transactions
  profilesSampleRate: 1.0,      // profile 100% of sampled transactions

  // Source maps + release health
  integrations: [
    nodeProfilingIntegration(),
    Sentry.httpIntegration({ tracing: true }),
    Sentry.expressIntegration(),
    Sentry.postgresIntegration(),
  ],

  // Privacy
  sendDefaultPii: false,
  beforeSend(event, hint) {
    // Drop noisy 404s before they leave the process
    if (event.request?.url?.includes('/healthz')) return null;
    return event;
  },
});Capturing Errors That Don't Crash the Process
Most production incidents are not crashes. They are 500s returned from a single endpoint, jobs that fail silently in BullMQ, or webhook handlers that throw inside a setTimeout. Auto-instrumentation catches the obvious cases — request handlers, database queries, outgoing HTTP — but you still need manual capture for code that lives outside the request lifecycle.
Manual captureException with context
const Sentry = require('@sentry/node');

async function syncUserToCrm(user) {
  try {
    await crmClient.upsert(user);
  } catch (err) {
    Sentry.withScope((scope) => {
      scope.setTag('integration', 'salesforce');
      scope.setContext('user', { id: user.id, plan: user.plan });
      scope.setLevel('error');
      Sentry.captureException(err);
    });
    // Surface to caller so the retry queue handles it
    throw err;
  }
}
Handling unhandled rejections explicitly
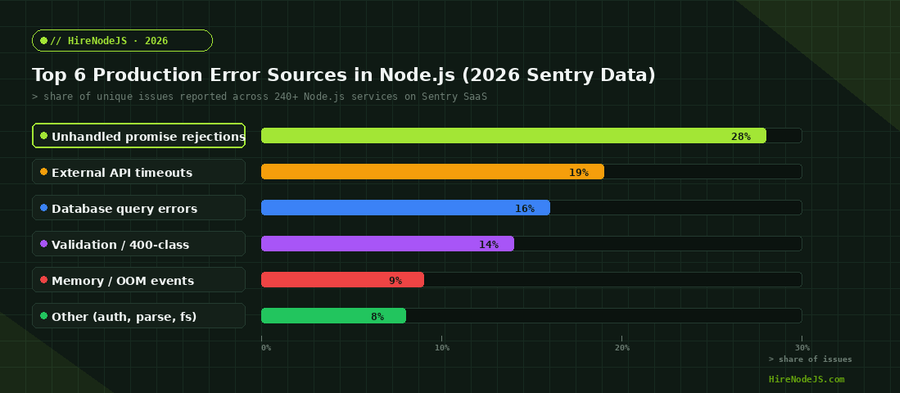
Sentry hooks process-level events for you, but you should still register your own handlers so log output stays informative and you decide whether to crash. The default behaviour in 2026 (Node 22+) is to terminate the process on `unhandledRejection`, which is usually what you want in containers — let the orchestrator restart you with a clean slate.
process.on('unhandledRejection', (reason) => {
  Sentry.captureException(reason);
  // Flush in-flight events before exit (max 2s)
  Sentry.close(2000).then(() => process.exit(1));
});

process.on('uncaughtException', (err) => {
  Sentry.captureException(err);
  Sentry.close(2000).then(() => process.exit(1));
});
Performance Monitoring and CPU Profiling
Sentry's tracing in 2026 is built on OpenTelemetry semantic conventions. You get distributed traces across HTTP boundaries, database spans, queue jobs, and outgoing fetch calls — without configuring an OTel collector. The companion profiler attaches CPU samples to slow transactions so you can see which JavaScript function ate the event loop, not just that the endpoint was slow.
Tuning tracesSampleRate for cost vs visibility
Sampling everything in production gets expensive fast. A good baseline is `tracesSampleRate: 0.1` for high-throughput services (over 100 req/s) and `1.0` for low-volume background workers where every job matters. For finer control, use `tracesSampler` to sample slow requests at 100% and healthy ones at 5% — most of your Sentry bill comes from successful, fast requests you do not need to inspect.
Hire Pre-Vetted Node.js Developers
Skip the months-long search. Our exclusive talent network has senior Node.js experts ready to join your team in 48 hours.
Sentry.init({
  dsn: process.env.SENTRY_DSN,
  tracesSampler: (samplingContext) => {
    const { name, attributes } = samplingContext;
    if (name?.includes('GET /healthz')) return 0;          // never trace
    if (attributes?.['http.status_code'] >= 500) return 1; // always trace errors
    if (name?.startsWith('queue.')) return 1;              // trace all jobs
    return 0.05;                                           // 5% baseline
  },
  profilesSampleRate: 1.0,
});Source Maps, Releases, and Release Health
Minified or bundled Node.js code (esbuild, tsup, Next.js standalone) shows up in Sentry as unreadable single-letter variables unless you upload source maps with every release. The 2026 SDK ships a sentry-cli wrapper and a build plugin for Vite, Webpack, Rollup, and Next.js that uploads source maps as part of your CI pipeline, then deletes the .map files from the production bundle so they are never served to the public.
Wiring releases into CI
Tagging events with a release ID gives you regression detection — Sentry will tell you when an issue first appeared in a release, when it was resolved, and whether a resolved issue regressed in a later deploy. The release should match the SHA or semver tag you ship.
# .github/workflows/deploy.yml
- name: Upload source maps to Sentry
  uses: getsentry/action-release@v1
  env:
    SENTRY_AUTH_TOKEN: ${{ secrets.SENTRY_AUTH_TOKEN }}
    SENTRY_ORG: hirenodejs
    SENTRY_PROJECT: api
  with:
    environment: production
    version: ${{ github.sha }}
sourcemaps: ./distAlert Routing and On-Call Triage Workflows
An issue that nobody sees is worse than no monitoring — it gives a false sense of safety. The 2026 best practice is to wire Sentry into the same alerting channels your infrastructure already uses: Slack for low-severity new issues, PagerDuty for spikes and high-error-rate alerts, and email digests for product owners who want a weekly read-out.
Alert rules that don't get muted
Three alert rules cover 90% of teams: (1) any new issue in production within the last 1 hour → Slack channel, (2) any issue with more than 100 events in 5 minutes → PagerDuty, (3) any issue tagged `release:current` that did not exist in the previous release → Slack with a #regression tag. The third rule is the single highest-signal alert in most setups; new code is by far the most common source of new errors.
Triage rituals that ship fixes
A team that owns its error budget needs to triage Sentry issues daily — not weekly. The most effective ritual is a 15-minute morning standup that walks through the top 5 unresolved issues by event count from the previous 24 hours, assigns each to an owner, and either closes (won't fix), snoozes (waiting on data), or files a Linear/Jira ticket. If you don't yet have engineers with that operational instinct, HireNodeJS can connect you with backend developers who have run on-call rotations on real production services.
Common Sentry Pitfalls and How to Avoid Them
Most failed Sentry rollouts share the same handful of mistakes. Knowing them upfront saves weeks of debugging and prevents the SDK from being silently disabled because someone got tired of noisy alerts.
Sending PII in event payloads
By default `sendDefaultPii: false` strips IP addresses and cookies, but custom context like `scope.setUser({ email })` will still send the email to Sentry. Treat Sentry as untrusted-by-default: hash user identifiers, strip request bodies, and use `beforeSend` to scrub fields that match a PII regex before they leave your process.
Initialising in the wrong order
If your traces are missing database spans, 99% of the time the cause is that `pg` or `mysql2` was `require()`d before Sentry. Move all Sentry init into instrument.js and ensure it is the first import of your entry file. This also applies to ESM — use a `--import ./instrument.js` Node flag rather than a top-level import in the same file.
Forgetting to flush in serverless
AWS Lambda and Cloudflare Workers freeze the process between invocations. If you don't call `Sentry.flush()` before returning, events buffered in memory get discarded when the runtime suspends. Always `await Sentry.flush(2000)` at the end of a Lambda handler.
For full serverless setup including cold-start considerations, see our Node.js + AWS Lambda Serverless Guide or the deeper observability with OpenTelemetry walkthrough.
Hire Expert Node.js Developers — Ready in 48 Hours
Building reliable Node.js services is only half the battle — you need engineers who instinctively reach for instrumentation, structured logging, and dashboards from day one. HireNodeJS.com specialises exclusively in Node.js talent: every developer is pre-vetted on real-world projects, production deployments, observability, and error-monitoring tools like Sentry, Datadog, and OpenTelemetry.
Unlike generalist platforms, our curated pool means you speak only to engineers who live and breathe Node.js. Most clients have their first developer working within 48 hours of getting in touch. Engagements start as short-term contracts and can convert to full-time hires with zero placement fee.
Conclusion — Sentry as the Default Reliability Layer
In 2026, instrumenting a Node.js service with Sentry takes under thirty minutes and pays back the first time a production bug fires at 2 a.m. and your team has a stack trace, breadcrumbs, release tag, and slow-transaction profile waiting in their Slack channel. The technology has matured to the point where the only reason not to instrument is organisational: nobody assigned, nobody triaged, nobody acted.
Pair a clean `instrument.js`, sensible sampling, source-map upload in CI, and a daily 15-minute triage ritual, and you will catch the vast majority of regressions in the release that introduced them — not three days later when a customer notices. The best teams treat their Sentry issue list like a second backlog: prioritised, owned, and closed weekly.
Frequently Asked Questions
How much does Sentry cost for a typical Node.js production service in 2026?
Sentry's Team plan starts at around $26/month and includes 50k errors plus 100k performance transactions. Most mid-sized Node.js APIs land in the $80–$400/month range once they tune sampling. Aggressive `tracesSampler` rules that drop health checks and sample healthy requests at 5% are the single biggest cost-control lever.
Should I use Sentry or Datadog APM for my Node.js application?
Sentry wins on error-first DX, source-map UX, and price-per-event. Datadog wins if you need APM unified with infrastructure, logs, and dashboards in one tool. Many teams run both — Sentry for exceptions and release health, Datadog for system metrics and traces.
Does @sentry/node still work with ESM and Node.js 22+?
Yes. Use the `--import ./instrument.js` flag on the Node command line (introduced in Node 20.6) so Sentry loads before your application modules. The legacy `--require` flag still works for CommonJS entry points.
How do I prevent Sentry from logging PII like emails and IP addresses?
Keep `sendDefaultPii: false` (the default), avoid calling `scope.setUser` with raw emails, and use a `beforeSend` hook to scrub request bodies and headers. For GDPR/HIPAA workloads, also enable Sentry's data scrubbing rules in the project settings.
What's the difference between traces sample rate and profiles sample rate?
`tracesSampleRate` controls what percentage of transactions Sentry records spans for. `profilesSampleRate` is conditional — it samples profiles only from already-sampled transactions. Setting profiles to 1.0 with traces at 0.1 gives you a CPU profile on 10% of requests, not 100%.
Do I need to hire a dedicated SRE to run Sentry properly?
No — most product teams run Sentry without a dedicated SRE. What you do need is a senior Node.js engineer who has lived through production incidents and instinctively reaches for instrumentation. HireNodeJS.com can connect you with that engineer in under 48 hours.
Vivek Singh is the founder of Witarist and HireNodeJS.com — a platform connecting companies with pre-vetted Node.js developers. With years of experience scaling engineering teams, Vivek shares insights on hiring, tech talent, and building with Node.js.
Need a Senior Node.js Engineer Who Owns Observability?
HireNodeJS connects you with pre-vetted senior Node.js engineers who treat Sentry, OpenTelemetry and on-call rotations as table stakes. Available within 48 hours, no recruiter fees.